Observability: The Cluster Telemetry Pipeline
Observability in Kubernetes is not just "monitoring"; it is the ability to understand the internal state of a complex distributed system based on the external data it exhausts. A "Bible-grade" stack relies on the PLG/PLP stacks (Prometheus, Loki/Linkerd, Grafana).
1. METRICS ARCHITECTURE (Prometheus)
Prometheus is a Pull-based Time Series Database (TSDB). In Kubernetes, we use the Prometheus Operator to manage this via Custom Resources.
1.1 The Scrape Loop Internals
- Service Discovery: Prometheus queries the API Server to find all Pod/Service endpoints.
- The Scrape: Every
scrapeInterval(e.g., 15s), Prometheus sends an HTTP GET to/metrics. - TSDB Injection: Data is stored in a head-block in RAM and eventually flushed to disk (WAL - Write Ahead Log).
1.2 The ServiceMonitor Pattern
The Prometheus Operator introduces the ServiceMonitor CRD. This decouples the monitoring configuration from the Prometheus server itself.
- Logic: The Operator watches for
ServiceMonitorobjects. It then automatically generates the complexprometheus.yamlscrape configuration and reloads Prometheus.
1.3 Bible-Grade YAML: ServiceMonitor
This manifest tells Prometheus to scrape any Service with the label app: payment-api in any namespace.
apiVersion: monitoring.coreos.com/v1
kind: ServiceMonitor
metadata:
  name: payment-api-monitor
  namespace: monitoring
  labels:
    release: prometheus-stack # Must match Prometheus object's serviceMonitorSelector
spec:
  # DISCOVERY: Find services with these labels
  selector:
    matchLabels:
      app: payment-api
  # SCOPE: Which namespaces to look in
  namespaceSelector:
    any: true
  # SCRAPE CONFIG:
  endpoints:
  - port: http-metrics
    path: /metrics
    interval: 15s
    scrapeTimeout: 10s
    # RELABELING: Add 'tier' label to the metric from the service metadata
    relabelings:
    - sourceLabels: [__meta_kubernetes_service_label_tier]
      targetLabel: tier
2. LOGGING ARCHITECTURE (Loki & Fluent-Bit)
For logs, we use a Push-based model to avoid the overhead of a central server trying to "tail" thousands of files.
2.1 The Log Pipeline (DaemonSet Pattern)
- Fluent-Bit (Collector): Runs as a DaemonSet on every node. It mounts
/var/log/pods. - Input: Reads the raw JSON logs from the Container Runtime (CRI).
- Filter/Parser: Uses the Kubernetes Filter to call the API Server and enrich the log entry with Pod Name, Namespace, Labels, and Annotations.
- Output: Pushes the enriched logs to Loki.
2.2 Loki: The Index-less Design
Loki is designed for Kubernetes. Unlike Elasticsearch, it does not index the full text of the logs. It only indexes the metadata labels (e.g., app=nginx, namespace=prod).
- Result: Extremely low storage cost and high ingestion speed.
2.3 Bible-Grade YAML: Fluent-Bit Configuration
This ConfigMap defines the high-performance pipeline for log enrichment.
apiVersion: v1
kind: ConfigMap
metadata:
  name: fluent-bit-config
  namespace: logging
data:
  fluent-bit.conf: |
    [SERVICE]
        Flush        1
        Log_Level    info
        Parsers_File parsers.conf

    [INPUT]
        Name             tail
        Path             /var/log/pods/*/*/*.log
        Parser           docker
        Tag              kube.*
        Mem_Buf_Limit    5MB

    [FILTER]
        Name             kubernetes
        Match            kube.*
        Kube_URL         https://kubernetes.default.svc:443
        Merge_Log        On
        Keep_Log         Off
        # CRITICAL: Enrich logs with K8s metadata
        K8S-Logging.Parser On
        K8S-Logging.Exclude On

    [OUTPUT]
        Name            loki
        Match           *
        Host            loki.logging.svc
        Port            3100
        Labels          job=fluentbit
        Auto_Kubernetes_Labels On
3. PRODUCTION STRATEGIES & PITFALLS
3.1 Prometheus Memory Management (The OOM Trap)
Prometheus keeps the last 2 hours of data in RAM (the "Head block"). In high-churn clusters (many short-lived pods), the number of series explodes (Cardinality Explosion).
- Architect Recommendation: Use External Labels and Remote Write (to Thanos or Cortex) to keep the cluster-local Prometheus lightweight.
- Bible Rule: Never scrape metrics with high-cardinality labels like
user_idororder_id.
3.2 Log Rotation and Disk Pressure
If Fluent-Bit fails to ship logs, the node's disk will fill up.
- Strategy: Configure the Container Runtime (
containerd) with strict log rotation policies. - Config:
# containerd config.toml
[plugins."io.containerd.grpc.v1.cri".containerd]
  log_size_max = 50000000 # 50MB
  log_version = 2
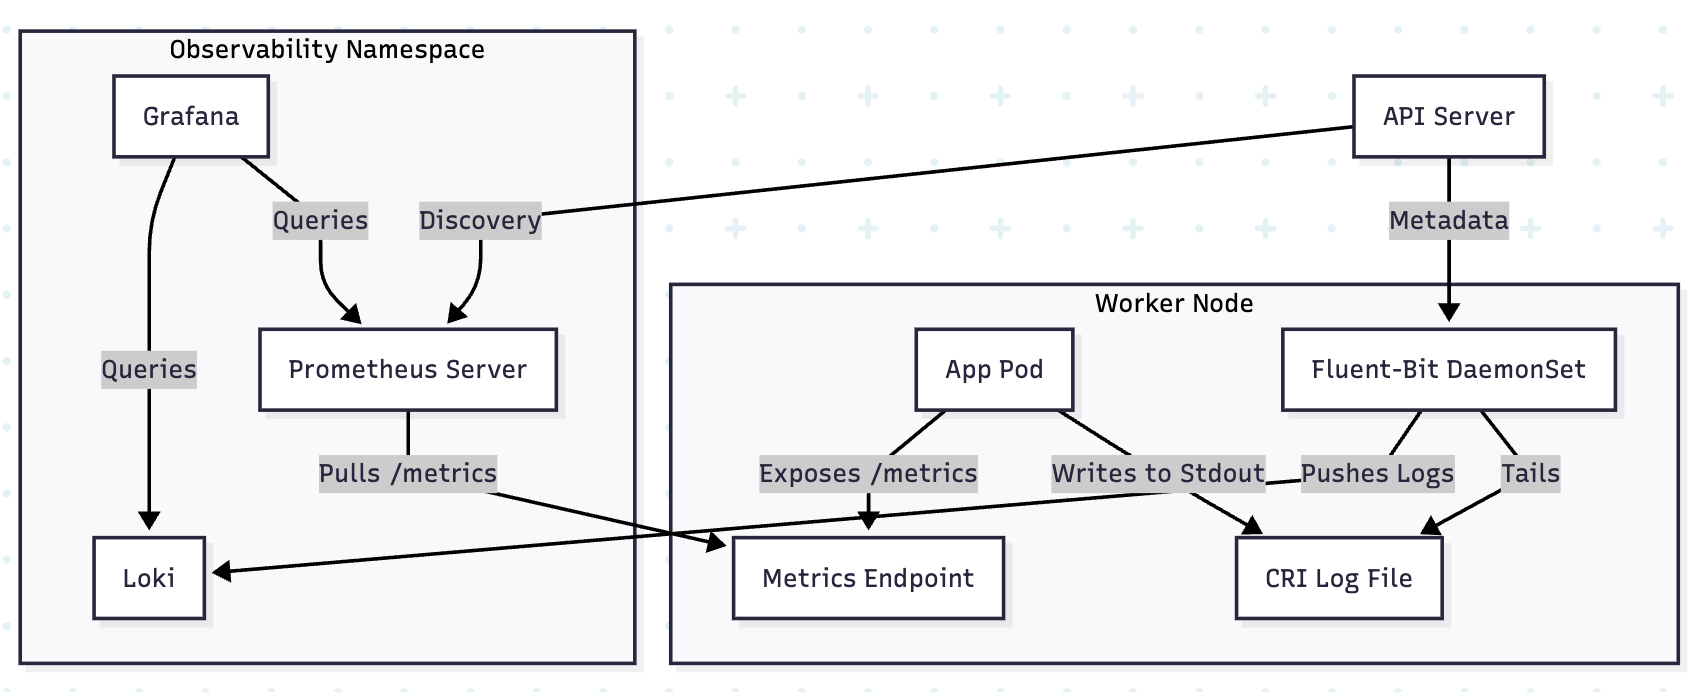
4. VISUAL: THE TELEMETRY DATA FLOW
5. TROUBLESHOOTING & NINJA COMMANDS
5.1 Checking Scrape Targets
If metrics aren't appearing in Grafana, check the Prometheus Targets UI or via CLI:
# Forward Prometheus UI to local
kubectl port-forward svc/prometheus-k8s 9090 -n monitoring
# Check targets: http://localhost:9090/targets
5.2 Auditing Log Enrichment
Verify if Fluent-Bit is successfully reaching the API Server to get pod labels:
kubectl logs -n logging -l app.kubernetes.io/name=fluent-bit | grep -i "kubernetes"
# Look for "error" or "connected to API server"
5.3 Prometheus Query (QL) for High Cardinality
Find which metrics are consuming the most memory:
# Top 10 metrics by series count
topk(10, count by (__name__) ({__name__=~".+"}))